Sales Data
Dec 2021- May 2022
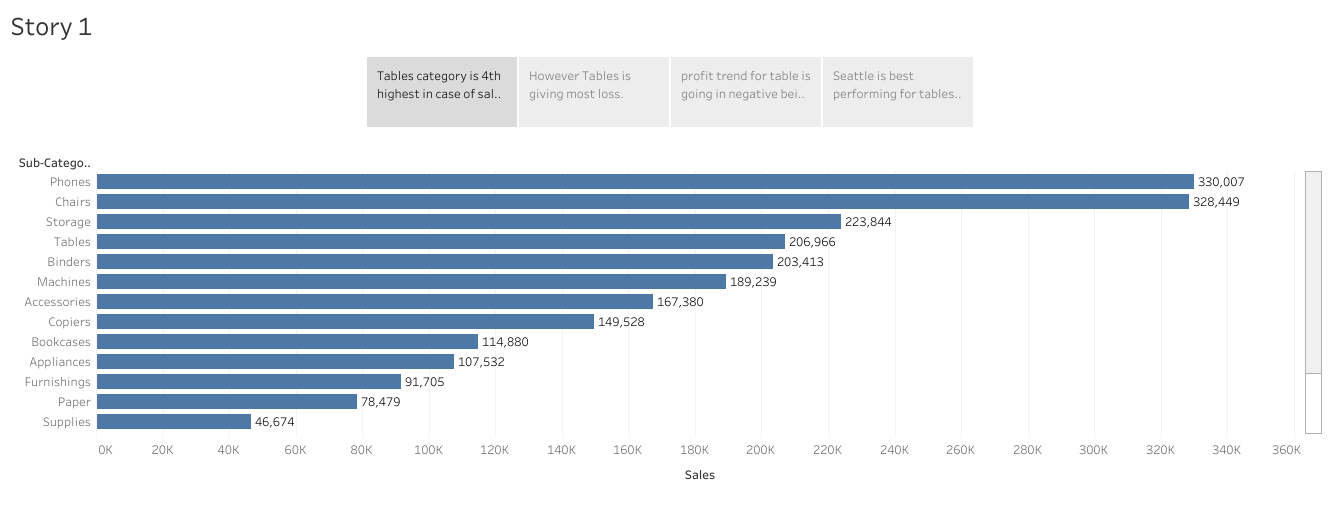
- The sales data reveals insights into various product categories, presented in a horizontal bar graph.
- Notably, the graph highlights 'Phones' and 'Chairs' as the top performers with the highest sales values.
- In contrast, the 'Table' category ranks fourth in terms of sales, while 'Supplies' represents the category with the least sales.
- Intriguingly, despite the 'Table' category ranking fourth in sales, it incurs the most significant losses, marked in red.
- The sales figure for 'Table' stands at $55,618, but the profit plunges to -$17,725.
- Conversely, categories like 'Phones' and 'Chairs,' highlighted in green, not only lead in sales but also contribute to substantial profits
.png)
- In a noticeable trend, the profit values consistently dip into negative territory during the month of the order date.
- This downward trend is evident in the line graph, indicating a period of decreased profitability within that timeframe.
.png)
- Upon a comprehensive comparison of various states and cities in the US, it's evident that Seattle emerges as the best-performing location for the 'Table' category in terms of profit.
- The data underscores Seattle's notable success in generating positive returns for this particular product category.
.png)